2026 Fantasy Football Injuries: The Draft Picks We’ve Lost and Why It Could Get Worse
The top 150 fantasy draft picks have missed 15.2% of their games through Week 9, the third-highest rate in 14 seasons, and 13 years of data show absences rise after Week 9
I’ve looked back through 15 years of NFL data to find out how badly the 2026 fantasy season has affected our draft picks. The results aren’t quite what I expected, and the numbers heading into the fantasy playoffs are worrying.
We’re 10 weeks into the NFL season, and I reckon most fantasy managers would struggle to name five players from their original draft who haven’t caused them some sort of headache. Whether it’s an injury, a suspension or somebody disappearing from the team entirely, getting your best players onto the field has become a weekly challenge.
We’ve all been there. You spend the summer researching players, building your rankings and deciding which positions you want to attack in your draft. You come away feeling pretty pleased with yourself, only to find that by November you’re starting somebody you hadn’t even heard of when the season began.
There’s been plenty of discussion about the number of injuries we’ve seen in 2026, particularly to some of the bigger fantasy names. It certainly seems worse than usual, but I’ve been wondering whether that’s actually true or whether we’re simply remembering the injuries that have hurt our teams the most.
I wanted to put some numbers behind it, so I went back through the pre-season ADP data and tracked the availability of the first 150 selections through Week 9. I’ve then compared those numbers with previous seasons going back to 2012, including what happened to those same groups of players after Week 9.
The interesting thing is that the biggest problem hasn’t necessarily been the players we spent our first-round picks on. Some of the worst damage has come further down the draft board, and that could explain why so many fantasy managers feel like they’re struggling to put a competitive team together.
The Real Damage Has Come Outside the First 50 picks
Let’s start with the numbers that surprised me most.
The first 50 players on our saved pre-season 12-team PPR ADP board have missed 57 of their 427 available games through Week 9. That works out at 13.3%, which isn’t great, particularly when you’re talking about players who were supposed to form the foundation of our fantasy teams.
However, when I expanded the research to include the first 150 selections, that percentage went up.
After removing eight team defences and four kickers, I was left with 138 quarterbacks, running backs, wide receivers and tight ends. Between them, those players have missed 179 of their 1,175 available games, giving us a missed-game rate of 15.2%.
The difference becomes clearer when you separate the first 50 picks from everybody drafted between 51 and 150.
| Draft range | Players | Missed games | Available games | Missed rate |
| Picks 1-50 | 50 | 57 | 427 | 13.3% |
| Picks 51-150 | 88 | 122 | 748 | 16.3% |
| Total | 138 | 179 | 1,175 | 15.2% |
Those 88 players drafted outside the first 50 account for 122 of the 179 missed games, or 68.2% of the total.
Now, there are obviously more players in that second group, which is why looking at the percentages is more useful than simply counting games missed. Even allowing for that, there’s still a difference of three percentage points between the groups.
It makes sense when you think about how most of us construct our fantasy teams. We expect our first few selections to provide consistent production, but we also need those middle-round picks to deliver. They’re the running backs we expect to use in our FLEX spots, the wide receivers we turn to during bye weeks and the players who give us some insurance when a starter goes down.
When those players start disappearing as well, it becomes much harder to replace the points we’ve lost elsewhere.
Some Draft Rounds Have Been an Absolute Disaster
I decided to break the full sample down into groups of ten selections, as I wanted to see whether particular areas of the draft were responsible for most of the missed games.
The results were all over the place.
| Draft picks | Players | Games missed / available | Missed rate |
| 1-10 | 10 | 7 / 85 | 8.2% |
| 11-20 | 10 | 13 / 84 | 15.5% |
| 21-30 | 10 | 11 / 87 | 12.6% |
| 31-40 | 10 | 15 / 85 | 17.6% |
| 41-50 | 10 | 11 / 86 | 12.8% |
| 51-60 | 10 | 9 / 86 | 10.5% |
| 61-70 | 10 | 17 / 86 | 19.8% |
| 71-80 | 10 | 11 / 85 | 12.9% |
| 81-90 | 8 | 7 / 67 | 10.4% |
| 91-100 | 10 | 24 / 85 | 28.2% |
| 101-110 | 8 | 1 / 65 | 1.5% |
| 111-120 | 10 | 19 / 85 | 22.4% |
| 121-130 | 7 | 18 / 60 | 30.0% |
| 131-140 | 7 | 8 / 60 | 13.3% |
| 141-150 | 8 | 8 / 69 | 11.6% |
| Total | 138 | 179 / 1,175 | 15.2% |
The most unfortunate group has been the players drafted between picks 121 and 130. They’ve missed 30% of their possible games, with 18 absences from just 60 opportunities.
It’s not much better for anybody who invested in picks 91-100. That group has lost 24 games from 85, which is 28.2%, while the players selected between 111 and 120 have missed 22.4%.
Even the group between picks 61 and 70 has been badly affected, with 17 games missed out of 86, or 19.8%.
But then look at picks 101-110.
That group has missed just one game from 65 possible, an absence rate of 1.5%. There are only a handful of draft positions separating those players from some of the worst-performing groups in the entire article, yet their availability has been completely different.
I think that explains why the experience of playing fantasy football this season has varied so much from manager to manager. Two people could have drafted relatively similar teams, with players taken only a few picks apart, and ended up having completely different seasons simply because of who was available.
And perhaps the most surprising finding is that our first ten selections have actually been relatively healthy. Those players have missed only seven of 85 available games, an 8.2% rate.
So while we’ve certainly had some high-profile injuries, it hasn’t been a case of every expensive player disappearing from fantasy teams.
Have Running Backs been Worse Than Wide Receivers?
I also wanted to know whether one position had been hit particularly hard.
Running backs have the highest missed-game rate among our 138 offensive players, although the difference between them and wide receivers isn’t enormous.
| Position | Players | Games missed | Available games | Missed rate |
| QB | 20 | 24 | 169 | 14.2% |
| RB | 44 | 66 | 374 | 17.6% |
| WR | 60 | 83 | 510 | 16.3% |
| TE | 14 | 6 | 122 | 4.9% |
| Total | 138 | 179 | 1,175 | 15.2% |
Running backs have missed 17.6% of their available games compared with 16.3% for wide receivers. Quarterbacks aren’t far behind at 14.2%, while tight ends have been considerably more reliable, missing only 4.9%.
Wide receivers have lost the most games overall, with 83, but that’s partly because there are 60 receivers in the article compared with 44 running backs.
It’s worth remembering that we’re measuring the players who were drafted inside the first 150 picks, rather than looking at every NFL player at each position. We also haven’t yet separated every injury absence from the other reasons players have missed games.
Still, if you’ve been constantly trying to patch up your running back or wide receiver positions, there’s plenty here that will sound familiar.
Where Does 2026 Rank Historically?
This was the part of the research I was most interested in.
It’s easy to remember the injuries from the current season because we’re living through them. Nobody is sitting there in November thinking about the players who missed three games in 2017 or the running backs who disappeared halfway through 2014.
So I went through the historical pre-season ADP lists, removed kickers and team defences, and matched the remaining players against NFL schedules, appearances and weekly roster data.
I used Fantasy Football Calculator for the ADP information, alongside Pro Football Reference and nflverse for the historical data.
The 2012 archive only contains 93 ranked selections, including 92 offensive players, and its appearance source lacks usable snap counts. That isn’t a complete top-150 sample, so I’ve excluded it from the direct historical comparison. That leaves 13 completed seasons from 2013 to 2025, plus 2026 through Week 9.
Here’s what I found.
| Season | Top-150 players | Games missed through W9 | W1-9 missed rate | W10-end missed rate | Full-season missed rate |
| 2026 | 138 | 179 / 1,175 | 15.2% | Not played | Not played |
| 2025 | 141 | 164 / 1,186 | 13.8% | 21.4% | 17.6% |
| 2024 | 146 | 180 / 1,249 | 14.4% | 19.7% | 17.0% |
| 2023 | 143 | 168 / 1,214 | 13.8% | 21.2% | 17.5% |
| 2022 | 142 | 146 / 1,204 | 12.1% | 21.7% | 16.9% |
| 2021 | 141 | 175 / 1,196 | 14.6% | 27.8% | 21.2% |
| 2020 | 143 | 197 / 1,190 | 16.6% | 23.2% | 19.8% |
| 2019 | 141 | 159 / 1,194 | 13.3% | 18.4% | 15.7% |
| 2018 | 142 | 153 / 1,188 | 12.9% | 21.2% | 16.9% |
| 2017 | 142 | 161 / 1,167 | 13.8% | 24.6% | 19.1% |
| 2016 | 143 | 185 / 1,192 | 15.5% | 21.0% | 18.1% |
| 2015 | 142 | 152 / 1,175 | 12.9% | 20.1% | 16.4% |
| 2014 | 142 | 142 / 1,191 | 11.9% | 16.4% | 14.0% |
| 2013 | 140 | 141 / 1,161 | 12.1% | 20.6% | 16.2% |
These figures measure missed games for any reason, with bye weeks excluded. NFL regular seasons ended in Week 17 through 2020 and Week 18 from 2021 onwards.
Now we can see why 2026 has felt so difficult.
Our 15.2% absence rate is the third-highest through Week 9 across those 14 comparable seasons. Only 2020, at 16.6%, and 2016, at 15.5%, have been worse at the same point.
That’s a pretty significant finding, particularly when you consider that 2026 hasn’t even reached the part of the season where historical availability has tended to get worse.
For a bit more context, I also looked separately at the top 50 players drafted each season, going all the way back to 2012. On that measure, 2026 ranks fifth-highest out of 15 seasons, with a 13.3% missed-game rate. The years ahead of it were 2016 (18.0%), 2020 (16.9%), 2025 (15.3%) and 2018 (14.3%).
Once again, it shows why looking beyond the biggest names matters. The first 50 picks haven’t been affected quite as badly as some previous seasons, but the wider group of players we rely on has been one of the least available we’ve seen.
The Part That Worries Me Most Comes After Week 9
If I was hoping the historical data would tell us that things tend to improve as the season progresses, I was disappointed.
Across the 13 completed seasons from 2013 to 2025, the top-150 draft groups missed 2,123 games from 15,507 available opportunities during the opening nine weeks. That’s an absence rate of 13.7%.
From Week 10 to the end of the regular season, those same draft groups missed 3,156 of 14,763 available games.
That’s 21.4%.
In other words, the rate of missed games was 7.7 percentage points higher during the later part of the season.
It wasn’t just one or two unusually bad years dragging the average upwards, either. Every completed season in the research had a higher missed-game rate after Week 9 than before it.
The least disruptive finish came in 2014, when the later-season absence rate was 16.4%. At the other end, 2021 saw that number climb all the way to 27.8%.
And 2025 is a useful recent example. Its top-150 group had a missed-game rate of 13.8% through Week 9, which was lower than the current 2026 figure. That rose to 21.4% over the remaining weeks, leaving the group with a 17.6% absence rate across the complete season.
Of course, those later absences don’t all come from new injuries. Some players get hurt early and remain sidelined, while others miss games for reasons completely unrelated to injury. Teams also make different decisions about player availability as the season goes on.
But the consequence for fantasy managers is the same. Historically, it has become harder to get the players we drafted onto the field as the regular season progresses.
With the fantasy playoffs approaching, that’s hardly encouraging.
Not Every Missed Game is an Injury
Before we go any further, there’s an important distinction in this research.
The figures I’ve used so far measure player availability. They don’t claim that every missed game was caused by an injury, and there’s a good reason for that.
Take Josh Jacobs, who was selected 98th on our saved ADP board. He missed his opening six games while on the Commissioner’s Exempt List. Those games absolutely count as missed opportunities for anybody who drafted him, but they aren’t injury-related absences.
His subsequent finger fracture, which requires surgery, is a separate injury situation.
I’ve been able to match 68 of the 179 missed games among this year’s top-150 selections directly to an injury-related Out designation in the weekly reports. For the top 50, the equivalent number is 22 of 57. Those figures represent 5.8% and 5.2% of the respective available player-games, but they’re minimum documented totals rather than complete injury rates.
Players on injured reserve don’t always appear in the weekly reports, and there are other absences that need checking individually. Simply labelling all 179 missed games as injuries would give us a misleading answer.
There’s also some useful research from Fantasy Squawk, which looked specifically at injury-related missed games across 1,509 drafted player-seasons between 2015 and 2025.
Their article found that 2025 had the highest full-season injury-related absence rate at 17.4%, closely followed by 2016 at 17.2% and 2021 at 16.9%. Other seasons were lower, including 2019 at 13.3% and 2020 at 14.1%.
Those are injury-specific figures over complete regular seasons, so they can’t be compared directly with our current nine-week availability numbers. What they do show is that injury-related absences have varied quite a bit from season to season, without increasing consistently every year.
And the Latest Injuries Could Make Things Even Worse
Unfortunately, the situation hasn’t stood still since the Week 9 numbers were collected.
As of 10 November, several important fantasy players have suffered injuries that could keep them out for significant periods, including some who were drafted particularly highly.
Michael Wilson is out for the season after suffering a neck fracture. He was selected 78th on our ADP board, and the Cardinals have eight remaining team games that he’ll now miss.
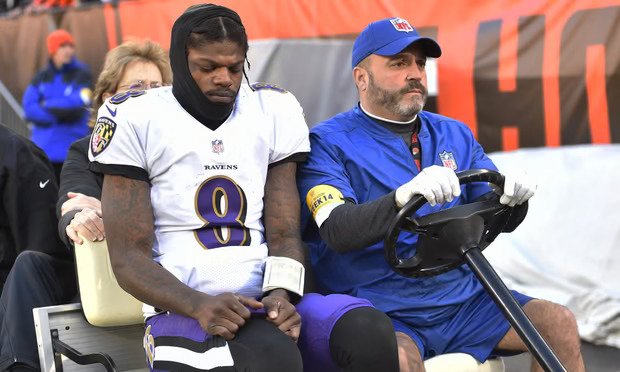
Lamar Jackson, drafted 54th, has been placed on injured reserve with a thumb injury. That’s at least another three games at risk, with the possibility of him missing the rest of the season.
Then there’s Puka Nacua, who was the third player selected in our pre-season data. He’s dealing with knee ligament sprains and turf toe, and the Rams indicated that injured reserve was likely in their 9 November statement. If that happens, he’d miss at least four games, although the placement wasn’t confirmed by that statement.
Davante Adams is already on injured reserve with a hamstring injury and no firm return date. Josh Jacobs has a fractured finger requiring surgery, with injured reserve a possibility, while Rhamondre Stevenson is dealing with a reported plantaris tendon issue behind the knee that’s expected to cost him multiple weeks.
It’s important not to treat every one of those situations as season-ending. Wilson’s absence has been confirmed, Jackson and Adams are on IR, and there are still decisions to be made about some of the others.
Nevertheless, these are the sort of absences that can change the direction of a fantasy season. Wilson and Jackson were outside the first 50 picks, so their missed games affect our wider top-150 analysis rather than the top-50 numbers. Nacua, on the other hand, impacts both groups, and losing somebody who cost the third overall pick is particularly painful.
How Bad Could Things Get by the End of the Season?
Rather than trying to guess which players might get injured next, I’ve used the historical missed-game rates to estimate how many games this year’s drafted players could lose over the remainder of the regular season.
Our 138 eligible top-150 players have 1,171 available games remaining after Week 9. Combined with the first nine weeks, that gives us 2,346 possible games for the full season, with bye weeks excluded.
We’ve already lost 179 games, so the next question is how many more could go.
The historical top-150 missed-game rate after Week 9 is 21.4%, which gives us a reasonable starting point. I’ve used three different scenarios, including a relatively healthy finish, a middle projection based on the historical average and a more difficult outcome similar to the worst late-season examples.
| Scenario | Remaining games missed rate | Additional games missed | Total missed games | Full-season rate |
| Low | 18% | 211 | 390 / 2,346 | 16.6% |
| Middle | 22% | 258 | 437 / 2,346 | 18.6% |
| High | 27% | 316 | 495 / 2,346 | 21.1% |
My middle forecast assumes that 22% of the remaining games will be missed, slightly above the historical average of 21.4%. That would mean another 258 absences from Week 10 onwards, taking us to 437 missed games across the season.
If things improve and the remaining missed-game rate is closer to 18%, we’d finish with 390 missed games and a full-season rate of 16.6%.
However, if 2026 follows one of the more disruptive historical patterns, with 27% of remaining games missed, we could reach 495 absences, or 21.1% of the complete season’s available games.
For comparison, the historical top-50 groups had a lower late-season missed-game rate of 19.3% from 2013 to 2025. Applying that to this year’s top 50 would give us approximately 139 missed games from 850 possible across the complete season, or 16.4%. The wider top-150 history is the better guide for the main forecast because it covers the same part of the draft board we’re trying to assess.
One thing worth making clear is that the projection already allows for future missed games. We can’t add Wilson’s eight remaining games, Jackson’s IR absence and Nacua’s potential missed games on top of the forecast, because that would risk counting them twice.
These are also projections of games missed for any reason, not predictions of how many new injuries the NFL will suffer. There’s no way to calculate an accurate future injury-only total from the availability figures alone.
What Does All of This Mean for our Fantasy Teams?
For me, the biggest takeaway from the research isn’t simply that 2026 has been a bad year for injuries.
It’s that the players we expected to provide the depth and consistency in our fantasy teams have been particularly difficult to keep on the field.
The first ten draft picks have missed only 8.2% of their available games, while some of the groups between picks 91 and 130 have lost more than 20%, and in one case 30%, of their opportunities. That’s a huge difference when you’re trying to build a team capable of winning consistently over a 14-week fantasy regular season.
It’s also made me think differently about how we approach roster construction. We spend a lot of time arguing about which first-round pick is safest, whether we should start RB or WR, and which players have the highest ceilings. That’s all important, but the value of having players who are actually available every week gets overlooked.
That doesn’t mean we should start drafting purely to avoid injuries. We can’t reliably predict every injury, and some of the absences in this article had nothing to do with injury risk in the first place. It does mean that the strength of our benches, how actively we work the waiver wire and our willingness to make trades can become increasingly important as the season develops.
And if history is anything to go by, those decisions become even more important from this point onwards.
So, How Bad Has 2026 Really Been?
If we look at the first 50 players drafted, 2026 is the fifth-worst of the 15 seasons I’ve examined for missed-game rate through Week 9. That’s hardly ideal, but it’s nowhere near enough to call it the worst season ever.
Expand the article to the top 150 selections, though, and the picture changes significantly.
The 138 offensive players in that group have missed 15.2% of their available games, making 2026 the third-worst early-season year among the comparable 2013-2026 cohorts. Only 2016 and 2020 have had a higher rate at this stage.
And perhaps most concerningly, the previous 13 completed seasons show that the rate of missed games has consistently increased after Week 9. We’ve gone from a historical average of 13.7% during the opening nine weeks to 21.4% during the remainder of the schedule.
If this season follows a similar pattern, we could end up losing somewhere between 390 and 495 games from our original top-150 draft group, with my middle forecast sitting at 437.
That wouldn’t automatically make 2026 the worst injury season in NFL history, because these totals include absences for reasons other than injury. It would, however, make it one of the more difficult seasons we’ve seen when it comes to getting the players we drafted onto the field.
We’ve already had to deal with a huge amount of disruption, and the latest injuries suggest there could be plenty more to come.
For those of us trying to win fantasy championships, that’s probably the most important part of this entire article. We’re not just dealing with what has already happened. We’ve still got the most important weeks of the season ahead of us, and keeping enough healthy, available players in our line-ups could be just as important as the talent we drafted back in September.